AgroX Selling Presentation
A dynamic presentation tailored for a specialized storage systems company.
Disclaimer
Some content shown in the project images has been replaced with Lorem Ipsum to protect sensitive and private research information from AgroX.
Context
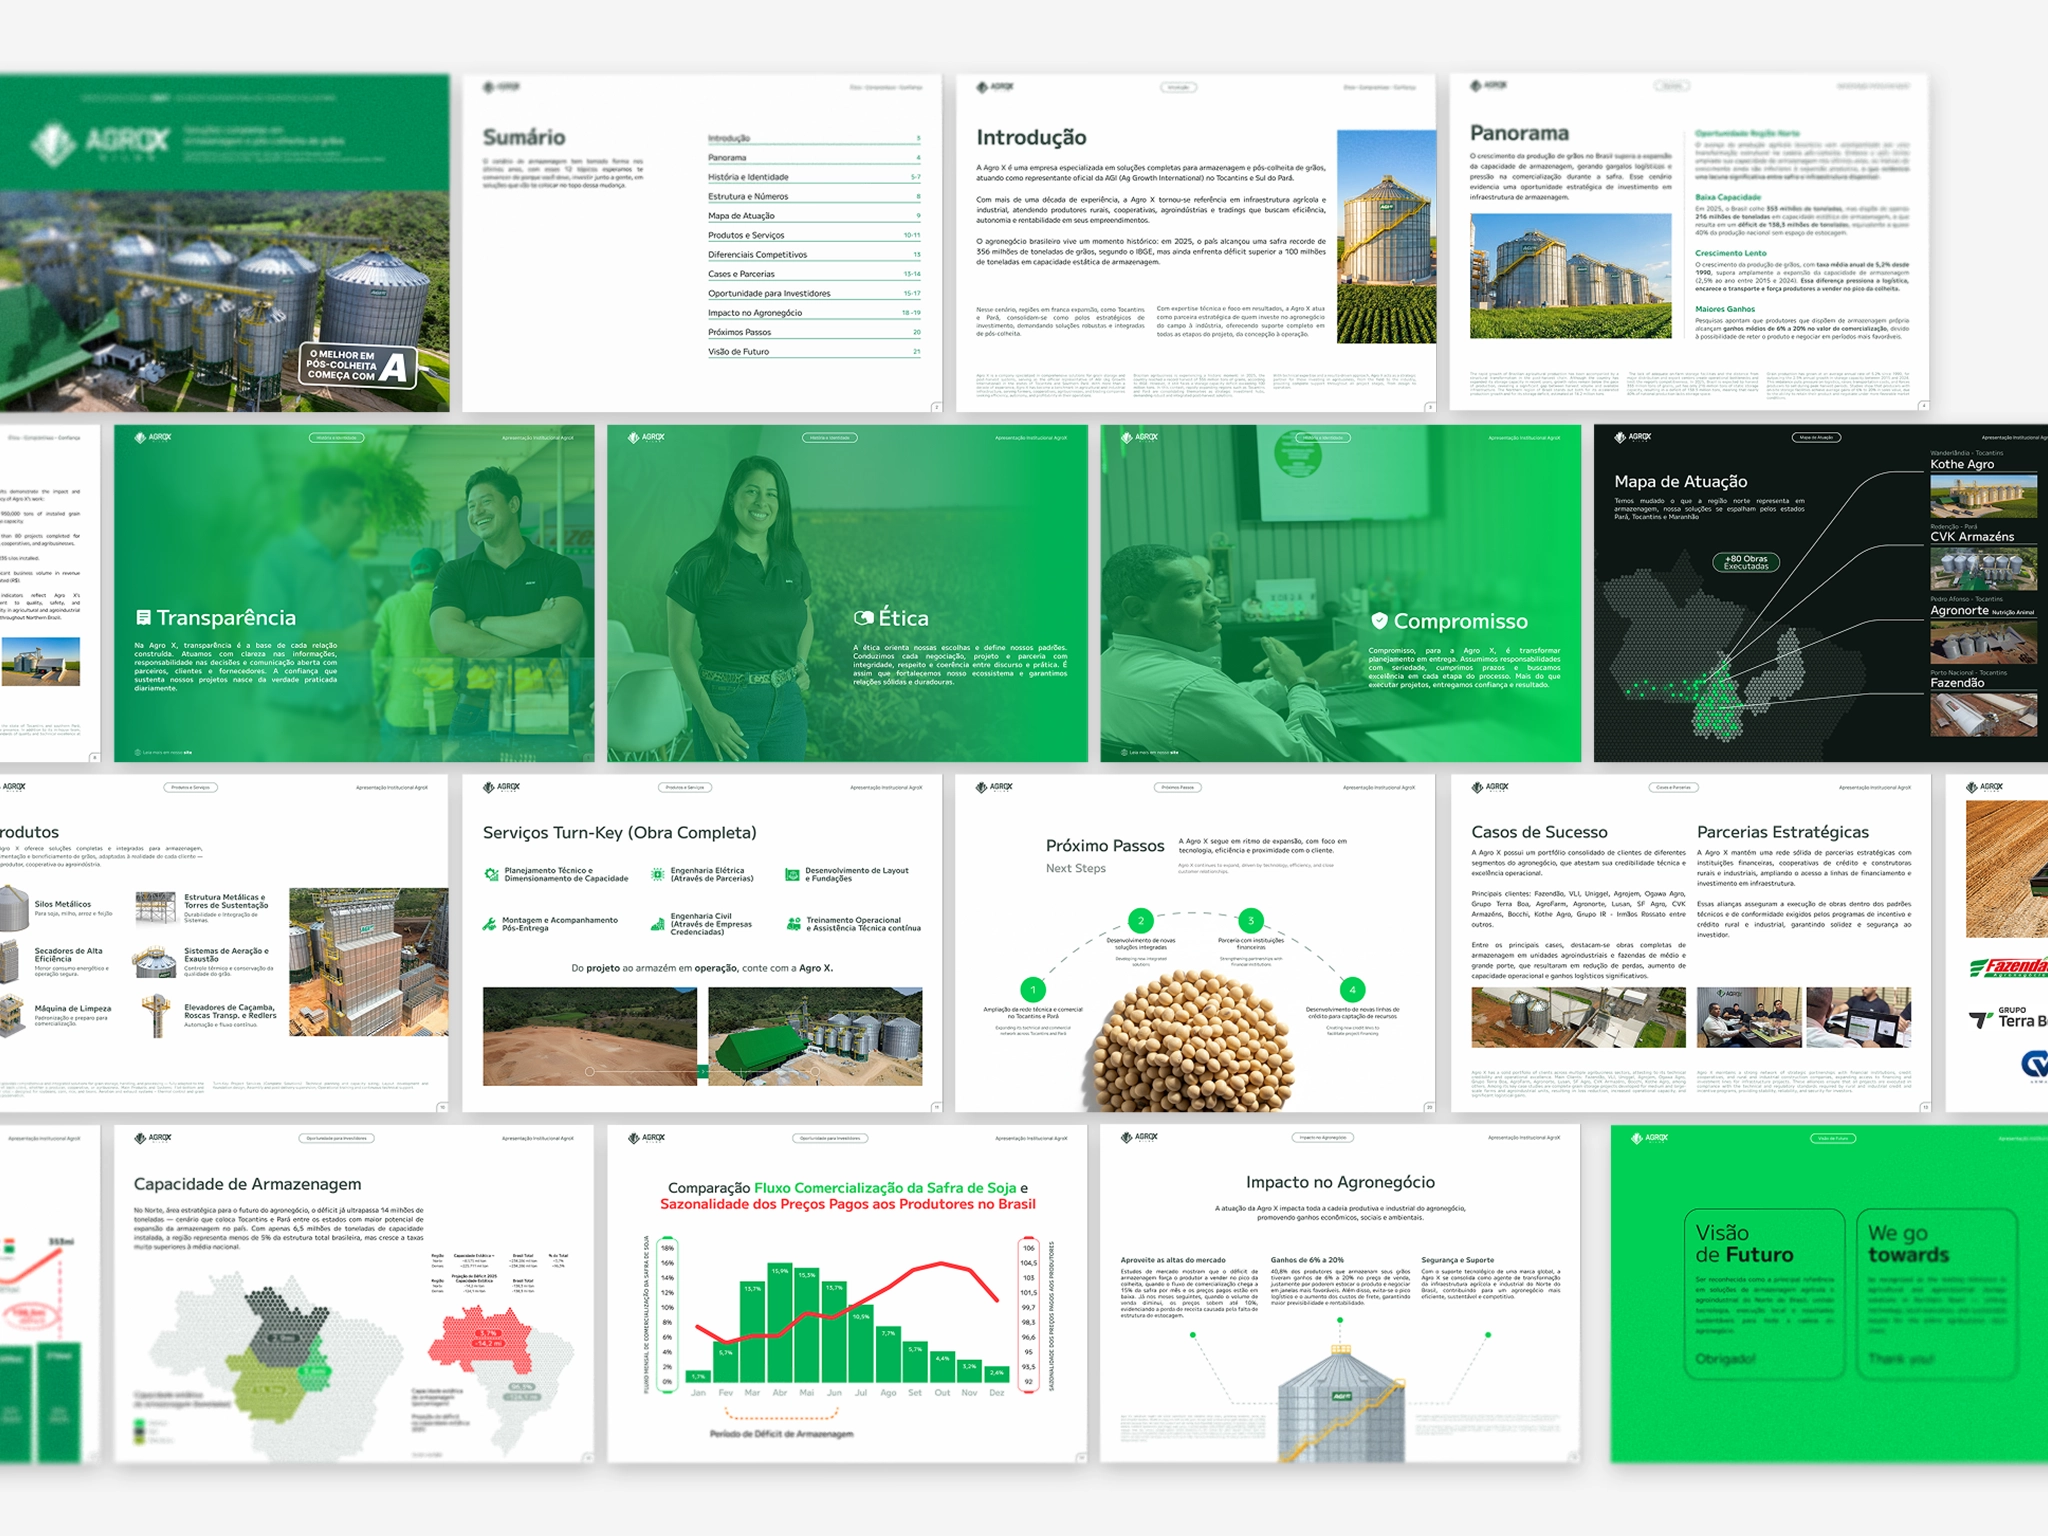
About the project
AgroX is an official AGI® representative specializing in the development of large-scale grain storage systems in Northern Brazil. With more than 80 projects delivered and over R$1 billion invested in integrated AGI® storage infrastructure, the company decided to develop a professional presentation to support its commercial strategy and communicate its expertise to agricultural producers in the region.
Objective
Competitive Market Positioning
The subject matter is highly technical and the audience extremely experienced. Agricultural producers in this sector are detail-oriented and accustomed to evaluating large investments carefully. The presentation therefore needed to avoid unnecessary marketing language and focus on clarity, credibility, and technical confidence.
The challenge was to communicate complex market data and infrastructure concepts while reinforcing AgroX’s capability to deliver high-quality integrated storage systems. Every slide had to balance informative content with a persuasive narrative grounded in real market conditions.
Structure
How we do that?
AgroX already possessed extensive internal research used daily by its sales team, particularly studies demonstrating the gap between Brazil’s grain production and its available storage capacity. This imbalance is even more pronounced in the northern region of the country.
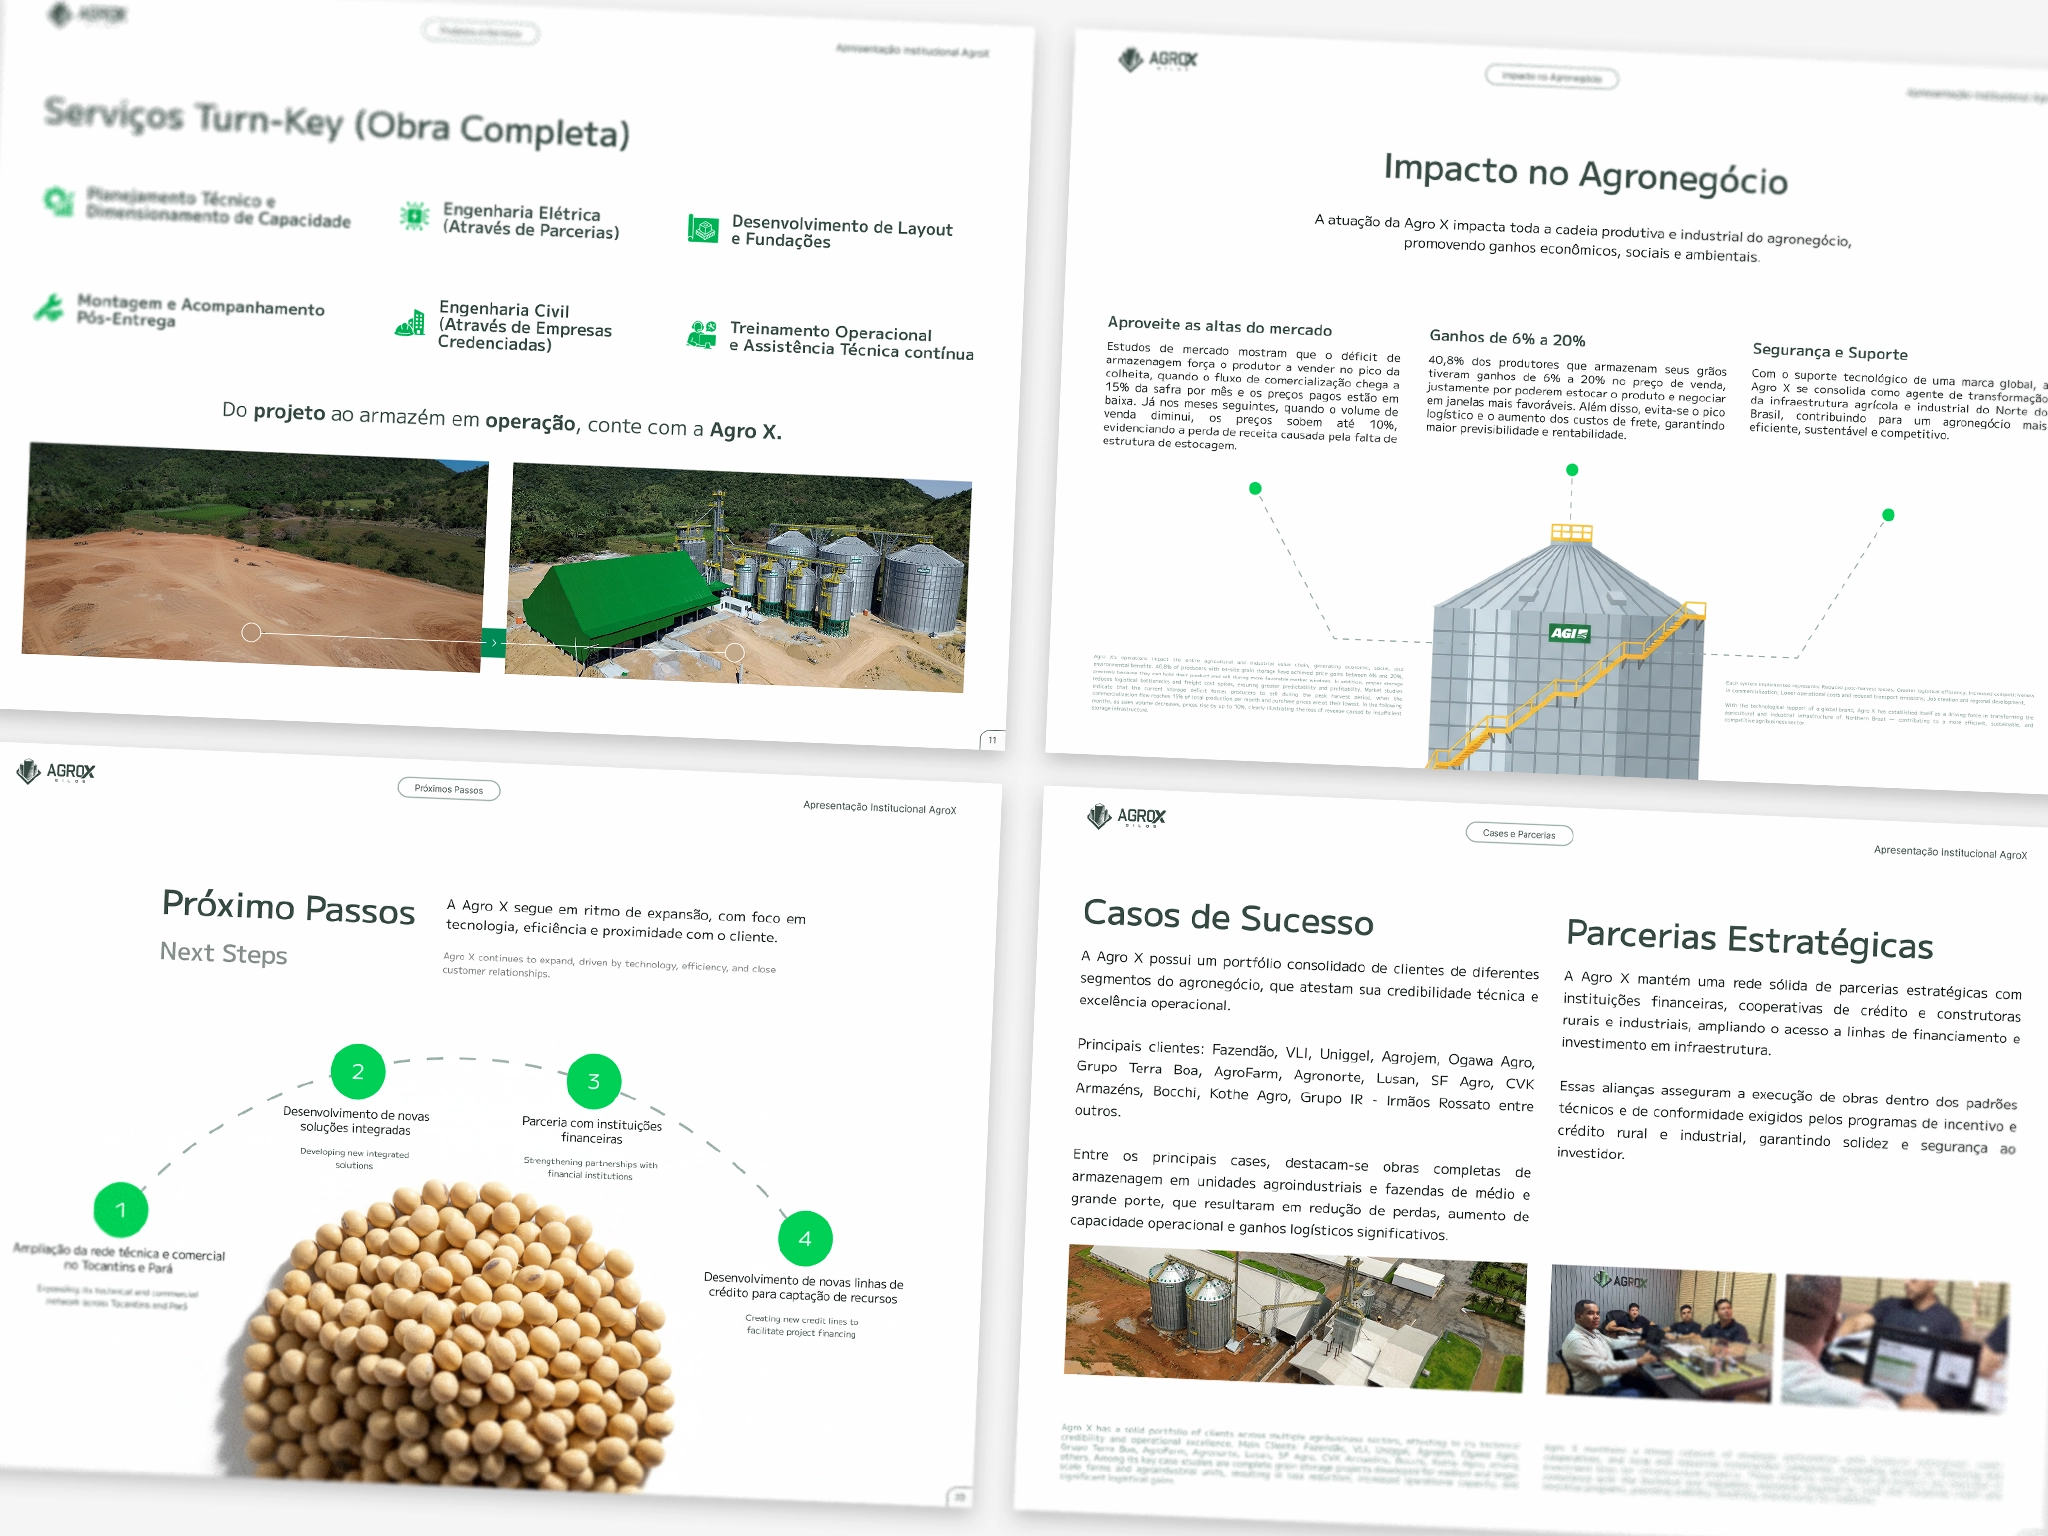
The role of the design process was to translate these technical studies, graphs, and datasets into a clear visual system that made the information easier to understand and faster to interpret during presentations.
By creating a cohesive identity and visual language for the slides, the final result became a professional business presentation where data, graphics, and narrative worked together seamlessly. Each graph and dataset references its original research source, while the presentation narrative highlights the strategic insights developed by AgroX’s specialists.
The communication needed to be concise, research-driven, and structured in a way that allowed clients to clearly understand both the current market situation and the opportunities available to them.
Grid System
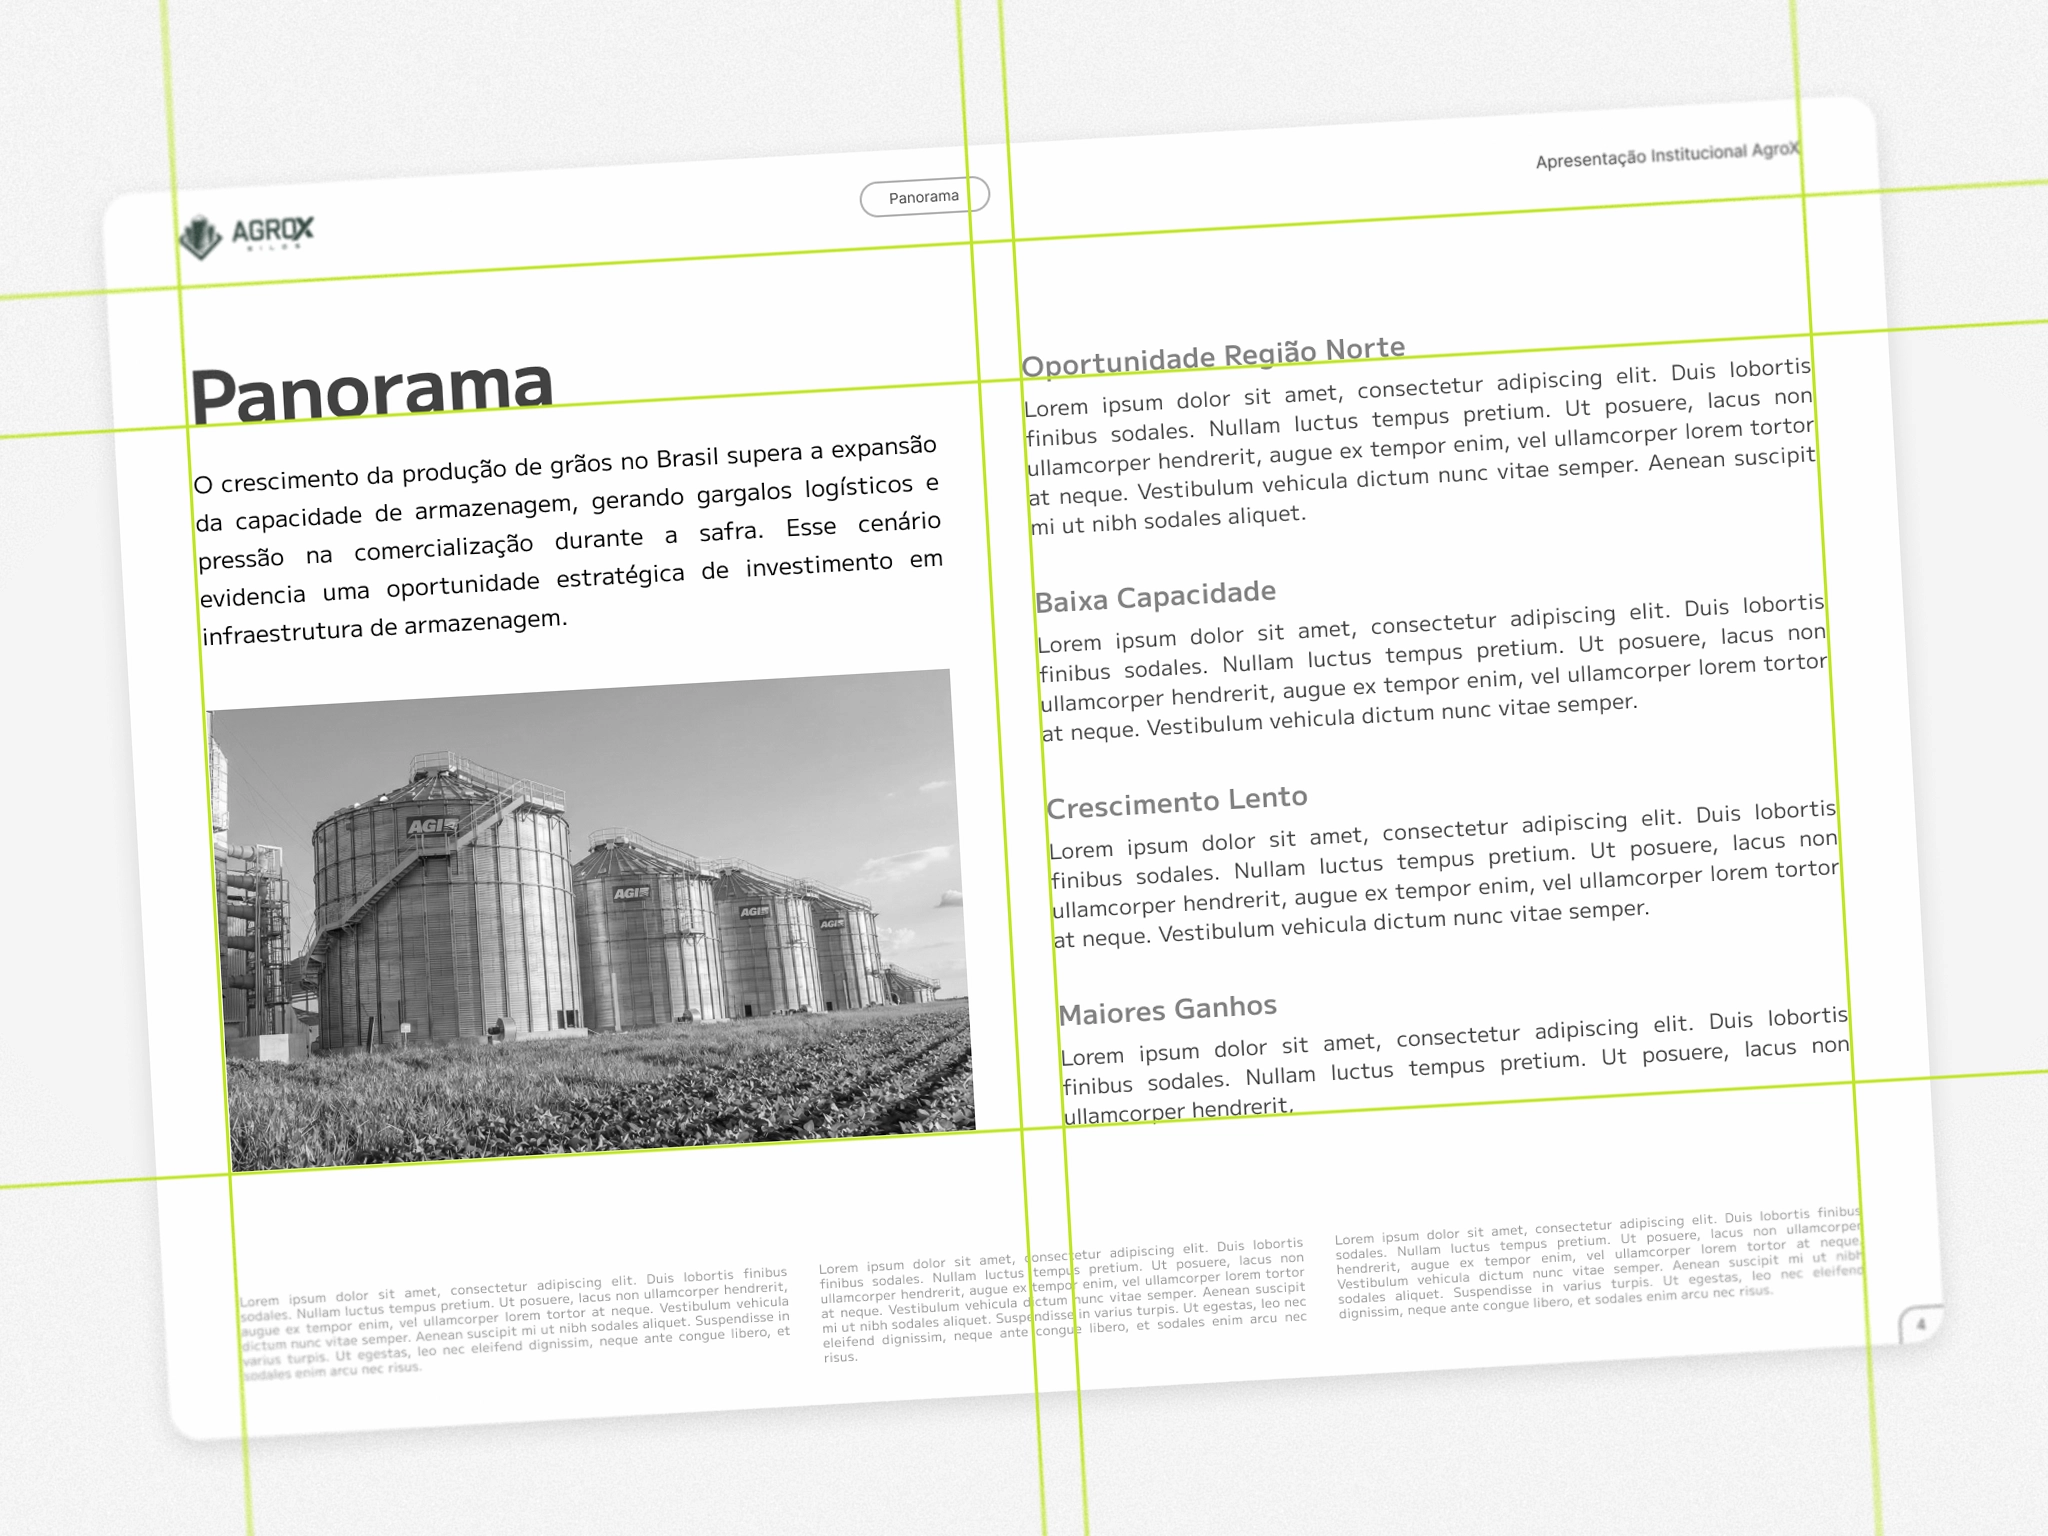
To ensure consistency across the presentation, a structured grid system was developed.
A five-column layout was used for pages combining text and imagery, while a three-column variation supported slides focused on key information or comparisons.
This approach created flexibility in page composition while maintaining visual rhythm and alignment across the entire presentation.
Component System
Developing reusable components early in the process proved essential for maintaining consistency and enabling efficient revisions.
Initial components were created with basic structural functions, allowing the layout process to begin quickly. As the presentation evolved, color, styling, and typographic refinements were applied globally through these components.
This system ensured that updates could be implemented consistently across the entire presentation while keeping the design scalable and organized.
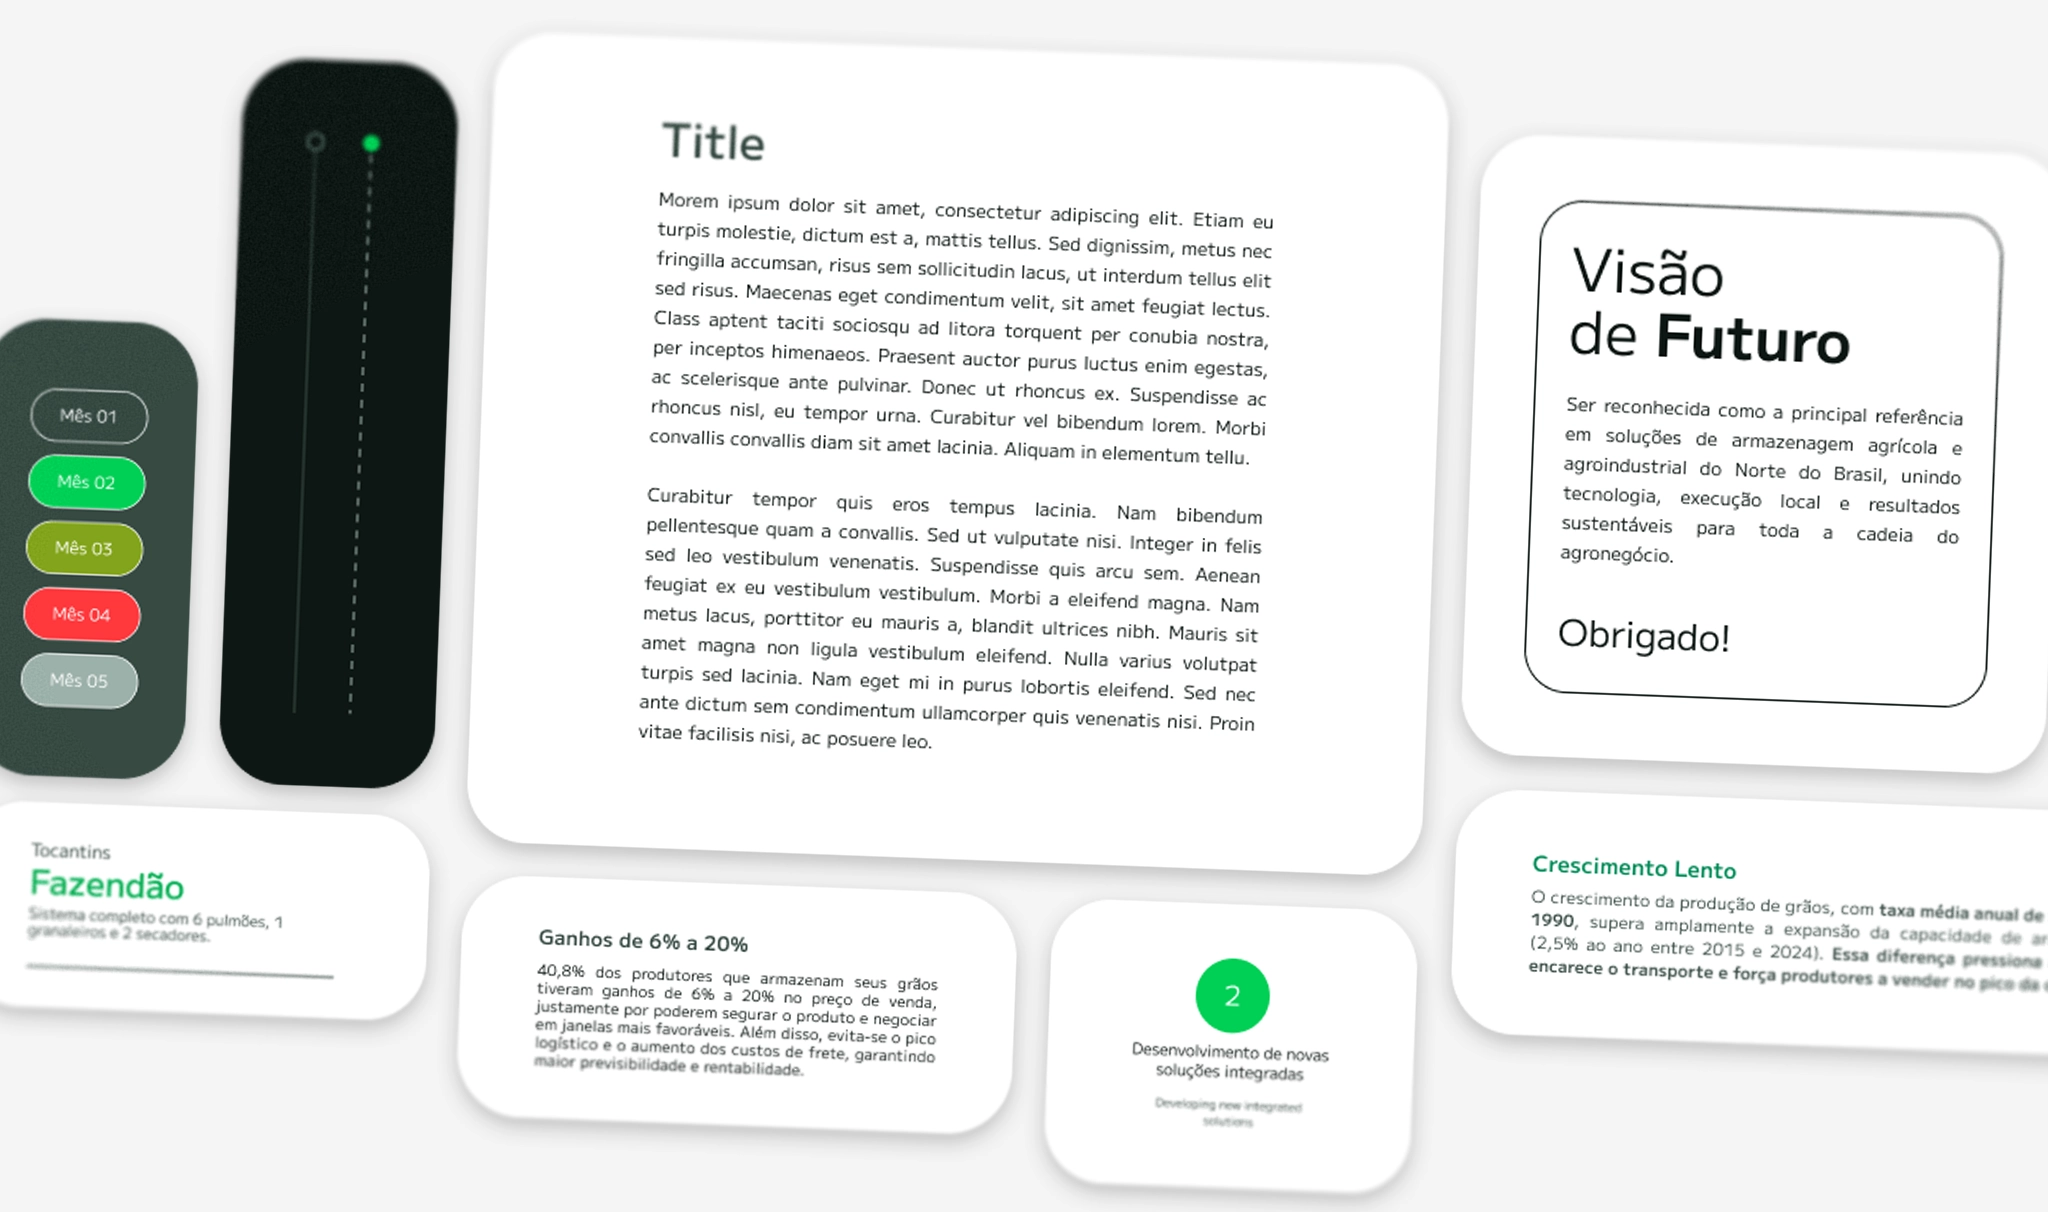
Image Retouch
Creating Visual Consistency with AI
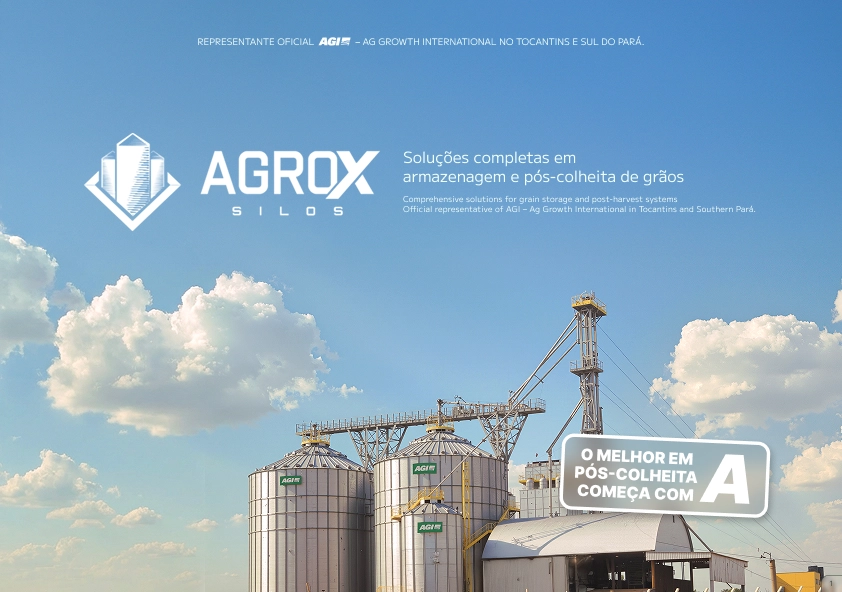
During previous social media projects, an AI-generated image of an AGI® silo was created and well received by the AgroX team. To maintain visual consistency throughout the presentation, the same visual direction was applied to other images.
AI-assisted image processing was used to adjust sky tone, color balance, and lighting conditions so that all images shared a cohesive visual atmosphere. In slides where specific client projects were showcased, the original photographs were preserved to avoid any potential misunderstanding regarding real installations.
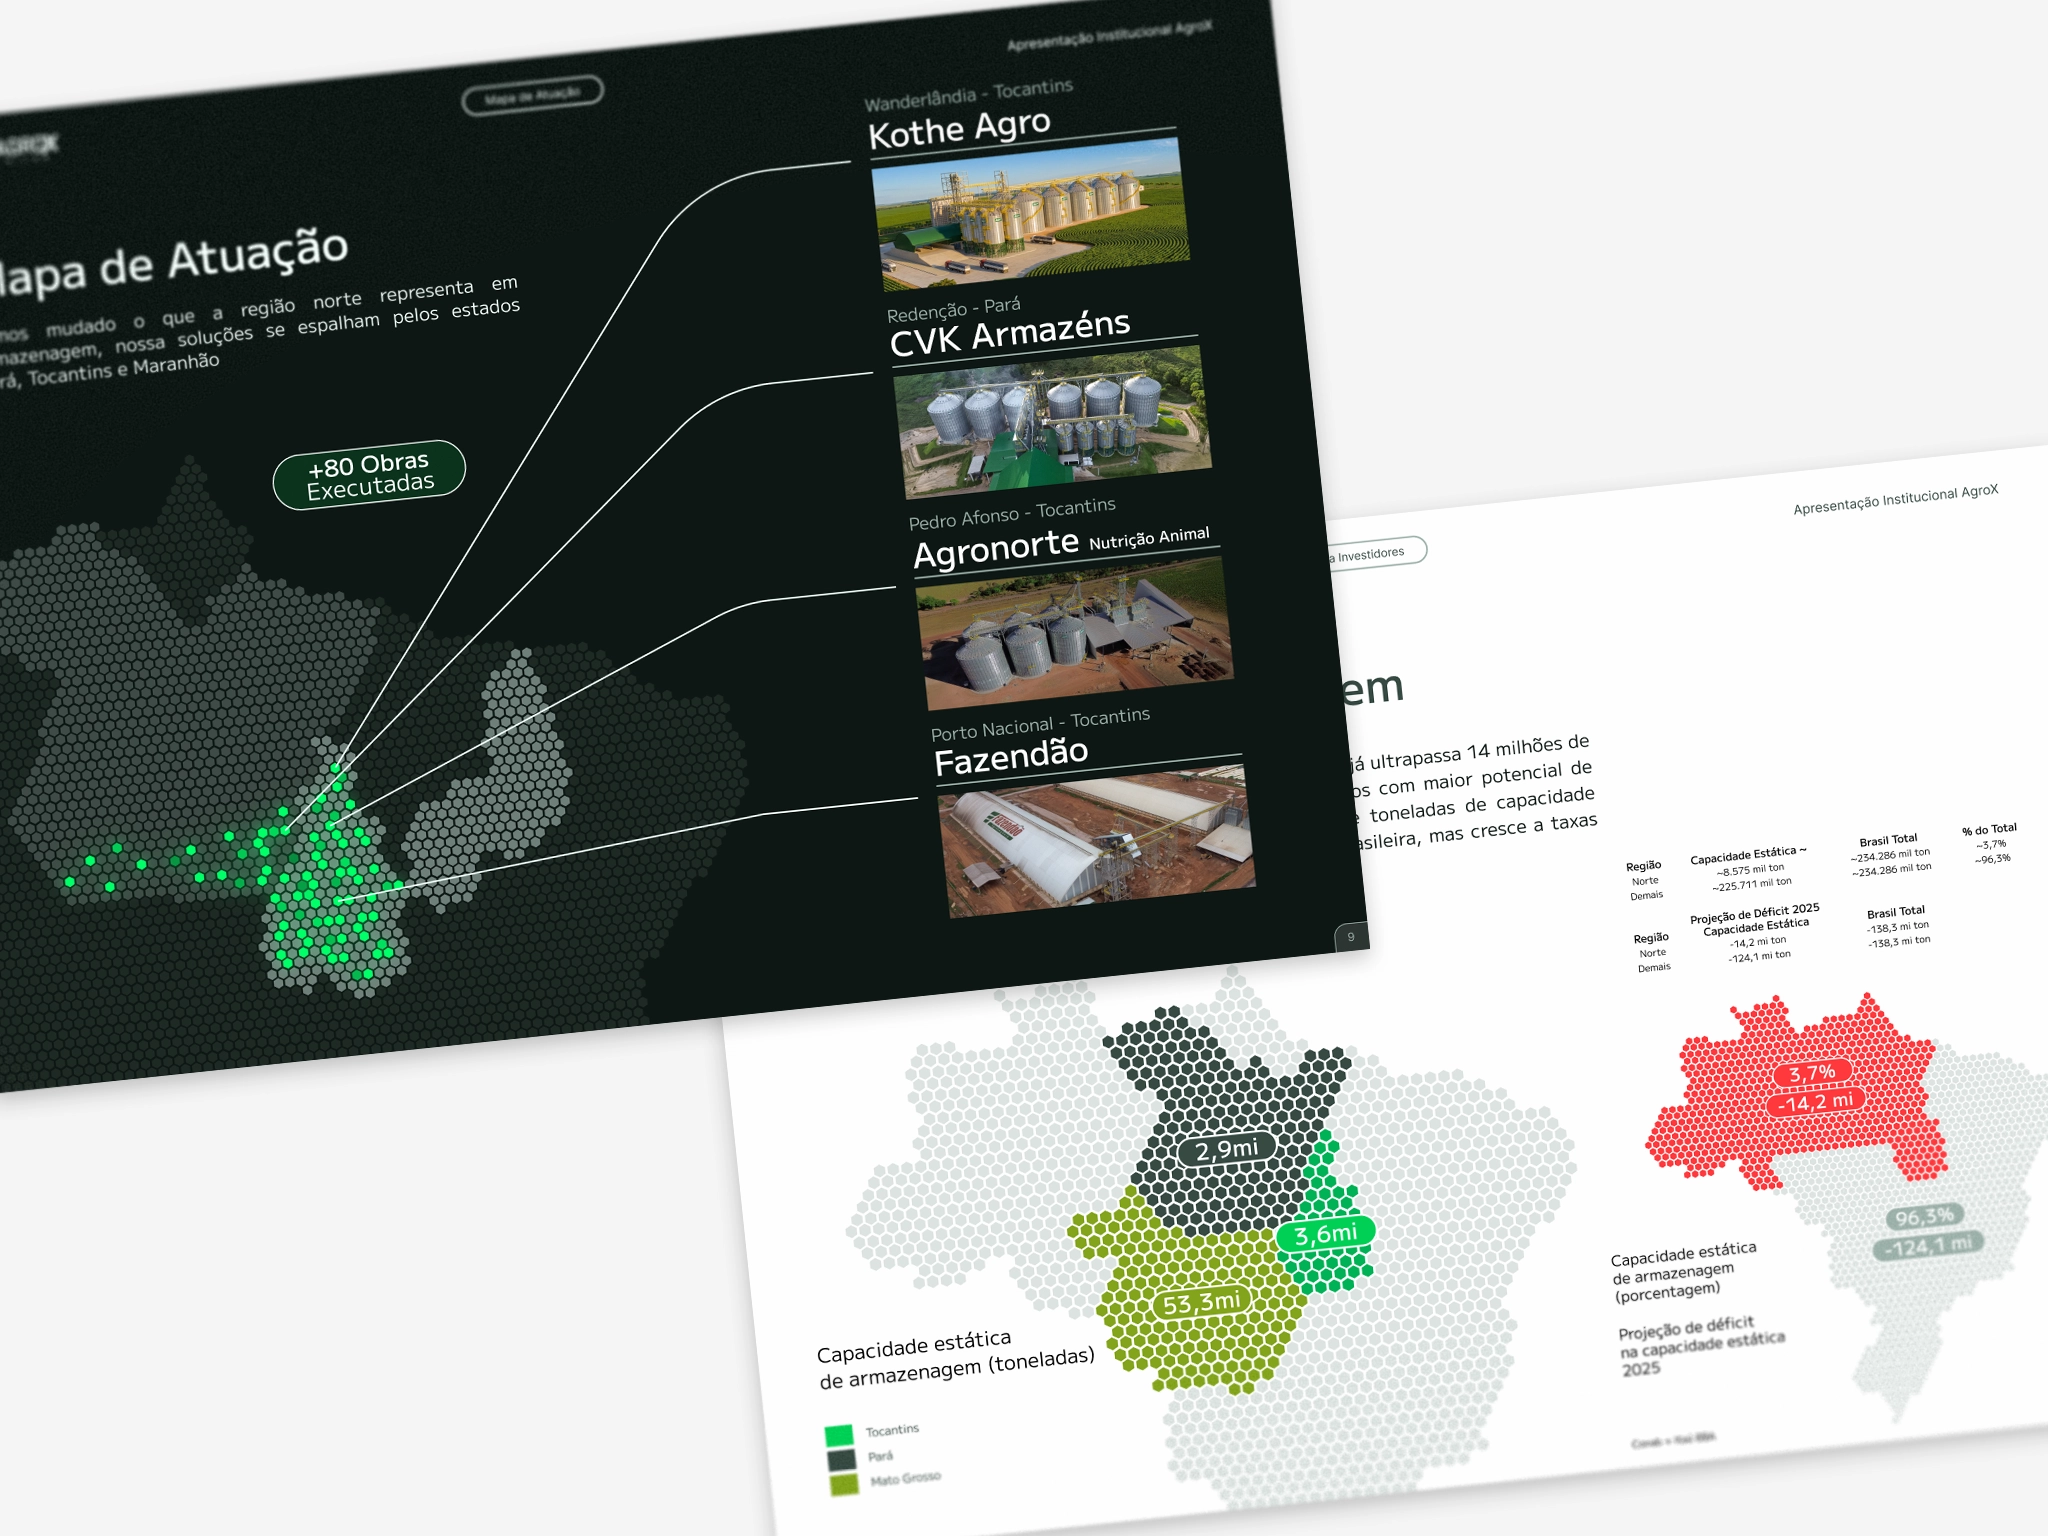
Hexmap
Maps became an important element early in the project. Much of the research relied on comparisons between Brazilian states, making geographic visualization essential for explaining the data.
Traditional maps contained excessive detail that distracted from the message. The solution was to simplify the geographic representation while preserving clarity and accuracy.
This led to the creation of a custom hexagonal map system (“Hexmap”), designed to balance visual clarity with analytical precision. The hexagonal structure simplified geographic relationships while allowing data comparisons to remain immediately understandable.
The resulting system provided a clean and engaging way to present regional data without overwhelming the audience.
Project Outcome
Complex market data into strategic communication
The project demonstrates how structured visual systems can transform complex technical content into persuasive communication. Through grid discipline, component design, and simplified data visualization, the presentation became a reliable tool for AgroX to communicate market opportunities and reinforce its expertise in large-scale storage infrastructure.